


分享ggpubr 包:教你绘制密度图、直方图、柱状图
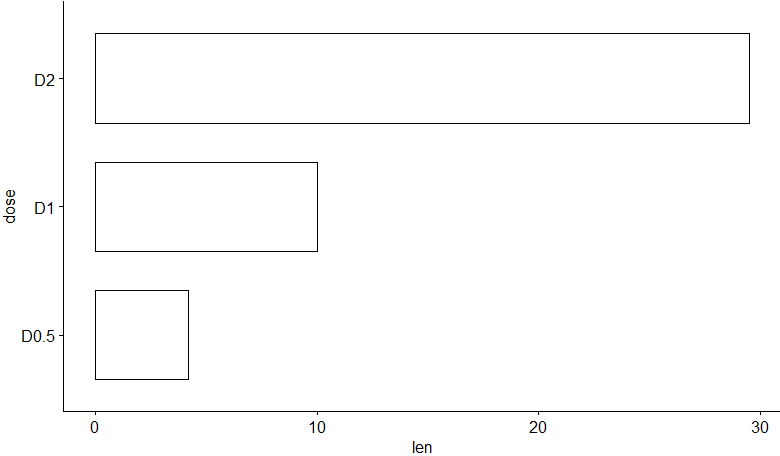
# 变换坐标轴的方向ggbarplot(df2, "dose", "len", orientation = "horiz")
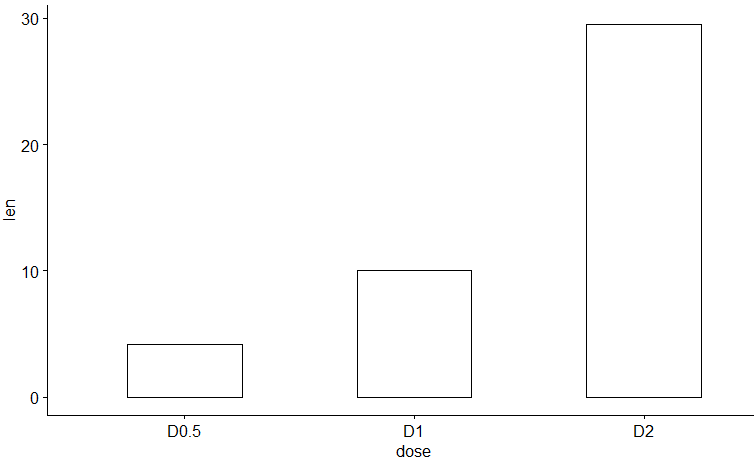
# 指定排列顺序ggbarplot(df2, "dose", "len", order = c("D2", "D1", "D0.5"))

# 更改填充色和边框色,并且将标签放在柱子内ggbarplot(df2, "dose", "len", fill = "steelblue", color = "black", label = TRUE, lab.pos = "in", lab.col = "white")

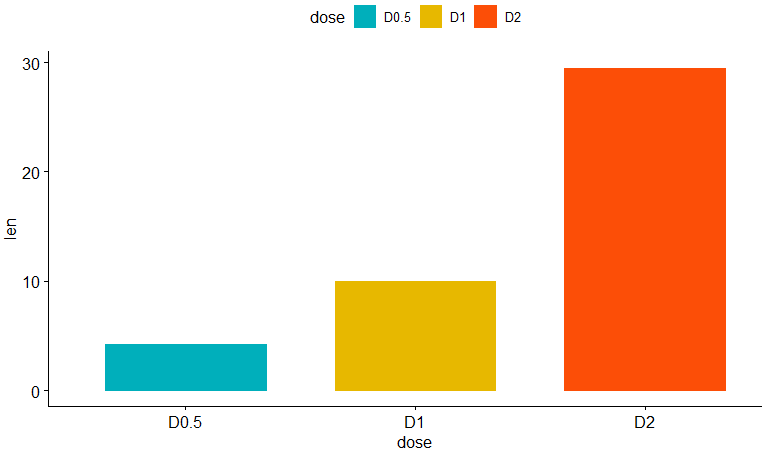
# 按照 x 轴"dose"的分组设定颜色ggbarplot(df2, "dose", "len", color = "dose", palette = c("#00AFBB", "#E7B800", "#FC4E07"))

ggbarplot(df3, "dose", "len", fill = "dose", color = "dose", palette = c("#00AFBB", "#E7B800", "#FC4E07"))
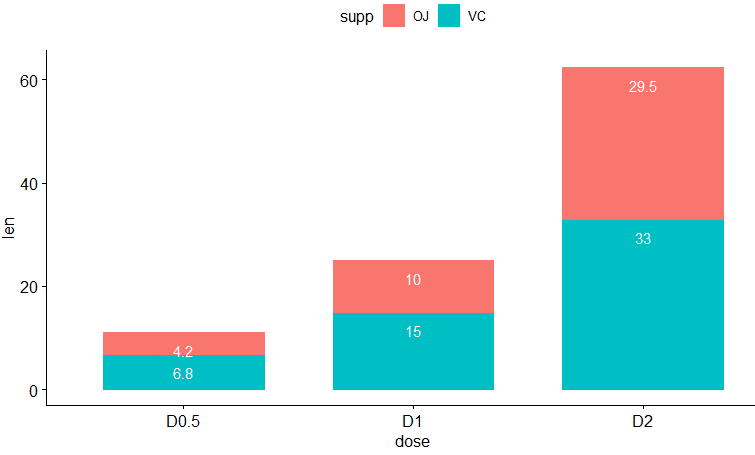
# 分组绘图# 构建数据df3 <- data.frame(supp=rep(c("VC", "OJ"), each=3), dose=rep(c("D0.5", "D1", "D2"),2), len=c(6.8, 15, 33, 4.2, 10, 29.5))print(df3)## supp dose len## 1 VC D0.5 6.8## 2 VC D1 15.0## 3 VC D2 33.0## 4 OJ D0.5 4.2## 5 OJ D1 10.0## 6 OJ D2 29.5
ggbarplot(df3, "dose", "len", fill = "supp", color = "supp", label = TRUE, lab.col = "white", lab.pos = "in")
# 更改排列方式ggbarplot(df3, "dose", "len", fill = "supp", color = "supp", palette = "Paired", label = TRUE, position = position_dodge())

ggbarplot(df3, "dose", "len", fill = "supp", color = "supp", palette = "Paired", label = TRUE, position = position_fill())

# 添加散点和误差——使用的是"ToothGrowth"数据集,ToothGrowth描述了维生素C对豚鼠牙齿生长的影响。3个变量60个观测值。[,1] 是len数字牙齿长度。[,2]是补充因子类型(VC或OJ)。[,3]是以毫克为单位的剂量。data("ToothGrowth")df4 <- ToothGrowthhead(df4)
# len supp dose# 1 4.2 VC 0.5# 2 11.5 VC 0.5# 3 7.3 VC 0.5# 4 5.8 VC 0.5# 5 6.4 VC 0.5# 6 10.0 VC 0.5
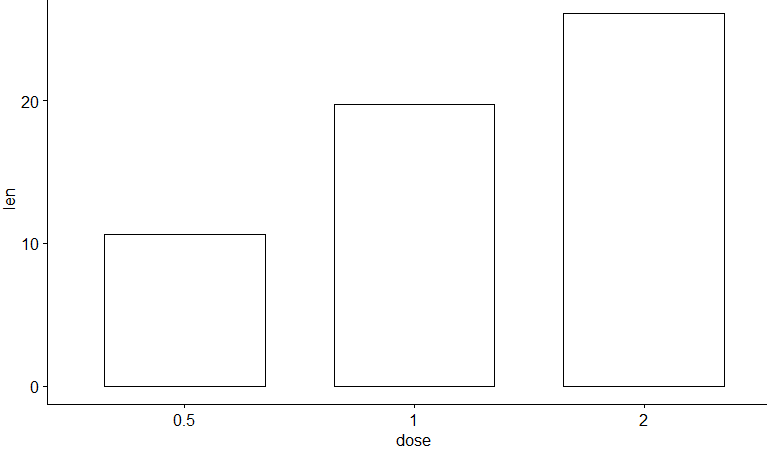
# 可以看出 x 轴的每一个分组都对应 y 轴上的多个取值ggbarplot(df4, x = "dose", y = "len")

# 展示每个组的均值ggbarplot(df4, x = "dose", y = "len", add = "mean")
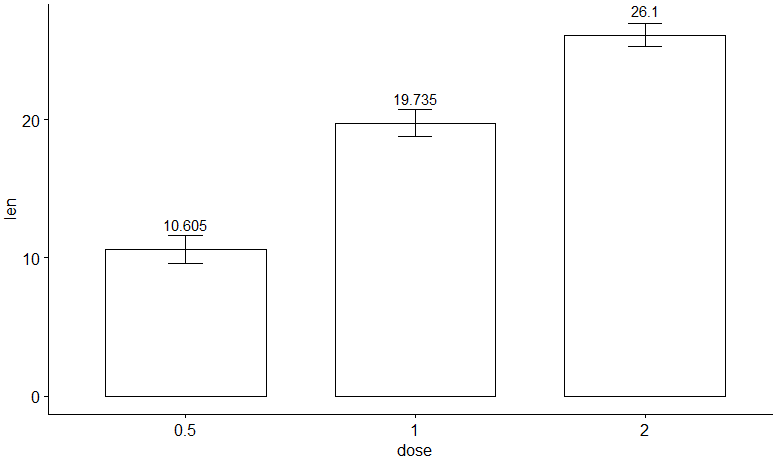
# 添加不同类型的误差棒(mean_sd, mean_ci, median_iqr, ....),调整 label 位置,其他的误差棒类型自行探索哈~ggbarplot(df4, x = "dose", y = "len", add = "mean_se", label = TRUE, lab.vjust = -1.6)
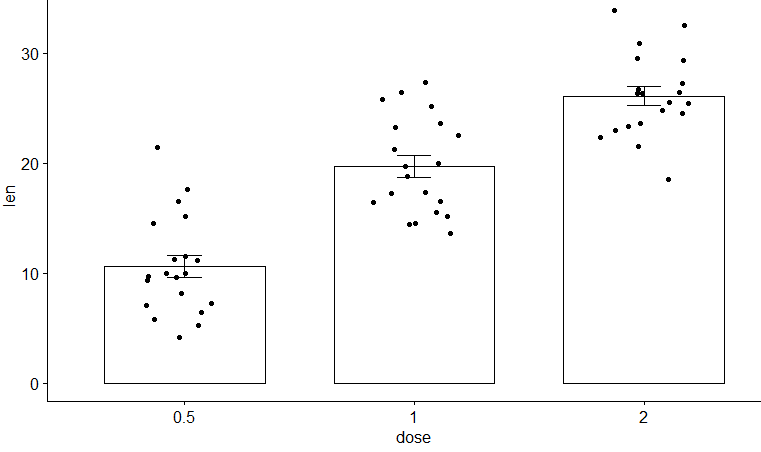
# 添加 jitter pointsggbarplot(df4, x = "dose", y = "len", add = c("mean_se", "jitter"))
# 添加 dot 小圆点
ggbarplot(df4, x = "dose", y = "len", add = c("mean_se", "dotplot"))

# 多个分组的条形图ggbarplot(df4, x = "dose", y = "len", color = "supp", add = "mean_se", palette = c("#00AFBB", "#E7B800"), position = position_dodge())

# 高级版来啦,用到的数据集是"mtcars"data("mtcars")df5 <- mtcarsView(df5)
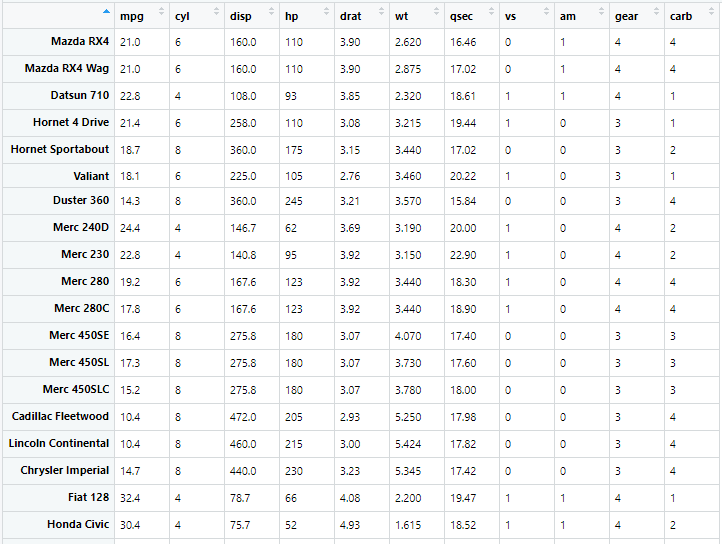
df5$cyl <- factor(df5$cyl) #不转化成因子的话后面画图会报错df5$name <- rownames(df5) #添加一行namehead(df5[, c("name", "wt", "mpg", "cyl")])
# name wt mpg cyl# Mazda RX4 Mazda RX4 2.620 21.0 6# Mazda RX4 Wag Mazda RX4 Wag 2.875 21.0 6# Datsun 710 Datsun 710 2.320 22.8 4# Hornet 4 Drive Hornet 4 Drive 3.215 21.4 6# Hornet Sportabout Hornet Sportabout 3.440 18.7 8# Valiant Valiant 3.460 18.1 6
# 柱状图展示不同车的速度,按cyl为分组信息进行填充颜色,颜色按nature配色方法,数值按降序排列。ggbarplot(df5, x="name", y="mpg", fill = "cyl", color = "white", palette = "npg", #杂志nature的配色 sort.val = "desc", #下降排序 sort.by.groups=FALSE, #不按组排序 x.text.angle=60)

# 组内进行排序
ggbarplot(df5, x="name", y="mpg", fill = "cyl", color = "white", palette = "aaas", #杂志Science的配色 sort.val = "asc", #上升排序,区别于desc,具体看图演示 sort.by.groups=TRUE,x.text.angle=60) #按组排序 x.text.angle=90

ggbarplot 函数 :
用法:
ggbarplot(data, x, y, combine = FALSE, merge = FALSE, color = "black", fill = "white", palette = NULL, size = NULL, width = NULL, title = NULL, xlab = NULL, ylab = NULL, facet.by = NULL, panel.labs = NULL, short.panel.labs = TRUE, select = NULL, remove = NULL, order = NULL, add = "none", add.params = list(), error.plot = "errorbar", label = FALSE, lab.col = "black", lab.size = 4, lab.pos = c("out", "in"), lab.vjust = NULL, lab.hjust = NULL, sort.val = c("none", "desc", "asc"), sort.by.groups = TRUE, top = Inf, position = position_stack(), ggtheme = theme_pubr(), ...)
参数:
data
所需的数据框 dataframe
x,y
进行作图所需的数据
combine
对于多个变量的数据是否分面。默认是FALSE
merge
对于多个变量的数据是否合并,默认是FALSE。
color
轮廓线的颜色
fill
填充色
palette
自定义颜色画板
size
设置点和轮廓线的大小
width
设置柱子的宽度,取值范围 0~1
title
设置标题
xlab
设置x轴标题,当 xlab = FALSE 时,可以将标题隐藏
ylab
设置y轴标题,当 ylab = FALSE 时,可以将标题隐藏
x.text.angle
x轴文本旋转角度
orientation
变换坐标轴的方向
facet.by
设置分组分面
panel.labs
设置分面各组的标题
short.panel.labs
是否缩写分面标题,逻辑值,默认是TRUE。
select
选择需要展示的变量
remove
移除不需要展示的变量
order
选定变量的排列顺序
add
添加图片元素:
"none", "dotplot", "jitter", "boxplot", "point", "mean", "mean_se", "mean_sd", "mean_ci", "mean_range", "median", "median_iqr", "median_mad", "median_range"
add.params
给add参数中添加的元素添加属性:olor, shape, size, fill, linetype
eg:add.params = list(color = "red")
error.plot
添加误差棒,选项有"pointrange", "linerange", "crossbar", "errorbar", "upper_errorbar", "lower_errorbar", "upper_pointrange", "lower_pointrange", "upper_linerange", "lower_linerange"。默认是"pointrange" or "errorbar".
label
设置列标签
lab.col, lab.size
设置 label 文本颜色和大小
lab.pos
设置 label 的位置,选项有:
"out" (for outside)
"in" (for inside).
Ignored when lab.vjust != NULL.
lab.vjust
垂直方向上调整 label 的位置。
Provide negative value (e.g.: -0.4) to put labels outside the bars or positive value to put labels inside (e.g.: 2).
lab.hjust
水平方向上调整 label 的位置。
sort.val
是否进行排序:
"none":无排序
"asc":升序(ascending)
"desc":降序(descending)
sort.by.groups
逻辑值,当为TRUE时,按照分组排序
top
确定要显示出来的 top elements 的数目
top elements
设置排列方式
legend.title
设置图例标题
ggtheme
设置画图主题,默认是theme_pubr()。
ggplot2 official themes: theme_gray(), theme_bw(), theme_minimal(), theme_classic(), theme_void()

 分享
分享
图片新闻


最新活动更多
-
6月13日立即参评>> 【评选】维科杯·OFweek2025中国工业自动化及数字化行业年度评选
-
7.30-8.1火热报名中>> 全数会2025(第六届)机器人及智能工厂展
-
7月30-31日报名参会>>> 全数会2025中国激光产业高质量发展峰会
-
即日-2025.8.1立即下载>> 《2024智能制造产业高端化、智能化、绿色化发展蓝皮书》
-
精彩回顾立即查看>> 宾采尔激光焊接领域一站式应用方案在线研讨会
-
精彩回顾立即查看>> 【在线会议】安森美Hyperlux™ ID系列引领iToF技术革新
推荐专题

中国智能制造数字化转型大会")


- 1 智造赋能,生态共融:大联大携手产业伙伴,共绘新质工业宏伟蓝图
- 2 谁将成为行业榜样?维科杯·OFweek2025中国工业自动化及数字化行业年度评选等您来参与!
- 3 开目新一代MOM:AI赋能高端制造的破局之道
- 4 【重磅来袭】6月17日上海见!全球智造巨头聚首,60余场前沿论坛,制造业数字化盛会邀您共启数智破局之旅!
- 5 当数智工业邂逅大湾区,看PHIIDF2025如何破界,链动全球!
- 6 安森美正式参评“维科杯·OFweek 2025中国工业自动化与数字化行业优秀产品奖”
- 7 世界计量日盛会启幕,聚焦测量体系变革:质量、效率与动力
- 8 欧姆龙正式参评“维科杯·OFweek 2025中国工业自动化与数字化行业优秀产品奖”
- 9 iEi威强电邀您共襄AIAE Expo 2025北京国际工业自动化盛会,探索智能工业新边界!
- 10 展会首日速递 | iEi威强电亮相北京AIAE Expo 2025,客户云集共话智能工业未来


发表评论
请输入评论内容...
请输入评论/评论长度6~500个字
暂无评论
暂无评论