


ggpubr包绘图技巧分享:饼图、棒棒糖图、Cleveland 点图
# 坐标轴旋转
ggdotchart(df5, x = "name", y = "mpg", group = "cyl", color = "cyl", palette = c('#999999','#E69F00','#56B4E9'), rotate = TRUE, sorting = "descending", ggtheme = theme_bw(), y.text.col = TRUE )

#设置点的大小:
ggdotchart(df5, x = "name", y = "mpg", group = "cyl", color = "cyl", size = "cyl", palette = c('#999999','#E69F00','#56B4E9'), rotate = TRUE, sorting = "descending", ggtheme = theme_bw(), y.text.col = TRUE )

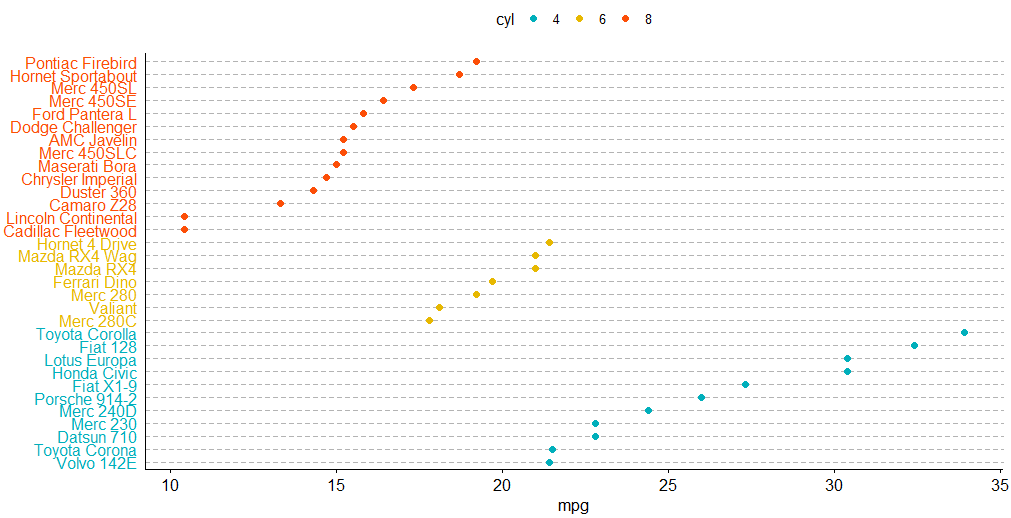
# 统一设定点大小,添加虚线网格
ggdotchart(df5, x = "name", y = "mpg", group = "cyl", color = "cyl", palette = c("#00AFBB", "#E7B800", "#FC4E07"), sorting = "descending", rotate = TRUE, dot.size = 2, y.text.col = TRUE, # Color y text by groups ggtheme = theme_pubr() # ggplot2 theme )+ theme_cleveland() # 添加虚线网格
# 添加标签
ggdotchart(df5, x = "name", y = "mpg", size="cyl", group = "cyl", color = "cyl", label = "name", font.label = list(size=10,color="red",face="bold"), # bold表示粗体字 palette = c('#999999','#E69F00','#56B4E9'), rotate = TRUE, sorting = "descending", ggtheme = theme_bw(), y.text.col = TRUE )

# 添加标签边框,避免重叠
ggdotchart(df5, x = "name", y = "mpg", size="cyl", repel = T, group = "cyl", color = "cyl", label = "name", label.rectangle = T, font.label = list(size=10,color="red",face="bold"), palette = c('#999999','#E69F00','#56B4E9'), rotate = TRUE, sorting = "descending", ggtheme = theme_bw(), y.text.col = TRUE )

 分享
分享
图片新闻


最新活动更多
-
6月13日立即参评>> 【评选】维科杯·OFweek2025中国工业自动化及数字化行业年度评选
-
7.30-8.1火热报名中>> 全数会2025(第六届)机器人及智能工厂展
-
7月30-31日报名参会>>> 全数会2025中国激光产业高质量发展峰会
-
即日-2025.8.1立即下载>> 《2024智能制造产业高端化、智能化、绿色化发展蓝皮书》
-
精彩回顾立即查看>> 宾采尔激光焊接领域一站式应用方案在线研讨会
-
精彩回顾立即查看>> 【在线会议】安森美Hyperlux™ ID系列引领iToF技术革新
推荐专题

中国智能制造数字化转型大会")


- 1 智造赋能,生态共融:大联大携手产业伙伴,共绘新质工业宏伟蓝图
- 2 谁将成为行业榜样?维科杯·OFweek2025中国工业自动化及数字化行业年度评选等您来参与!
- 3 开目新一代MOM:AI赋能高端制造的破局之道
- 4 【重磅来袭】6月17日上海见!全球智造巨头聚首,60余场前沿论坛,制造业数字化盛会邀您共启数智破局之旅!
- 5 当数智工业邂逅大湾区,看PHIIDF2025如何破界,链动全球!
- 6 安森美正式参评“维科杯·OFweek2025中国自动化领域年度最具竞争力创新产品奖”
- 7 世界计量日盛会启幕,聚焦测量体系变革:质量、效率与动力
- 8 iEi威强电邀您共襄AIAE Expo 2025北京国际工业自动化盛会,探索智能工业新边界!
- 9 欧姆龙正式参评“维科杯·OFweek 2025中国工业自动化与数字化行业优秀产品奖”
- 10 展会首日速递 | iEi威强电亮相北京AIAE Expo 2025,客户云集共话智能工业未来


发表评论
请输入评论内容...
请输入评论/评论长度6~500个字
暂无评论
暂无评论